Maritime surveillance
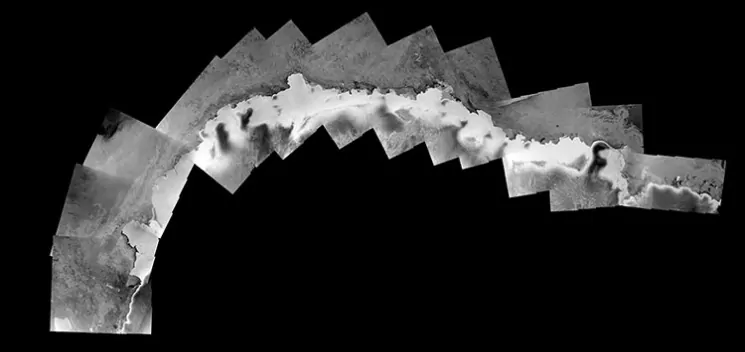
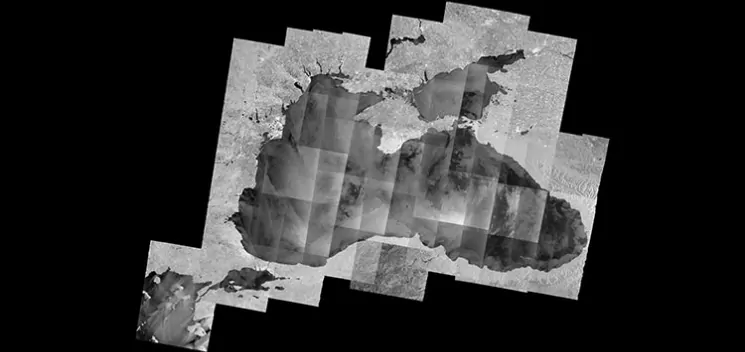
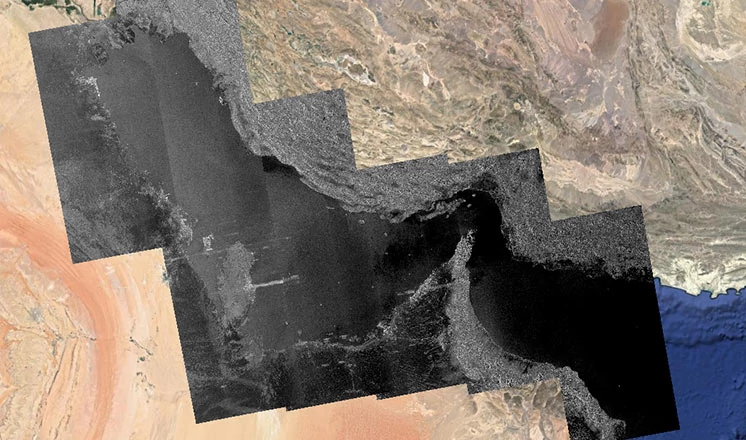
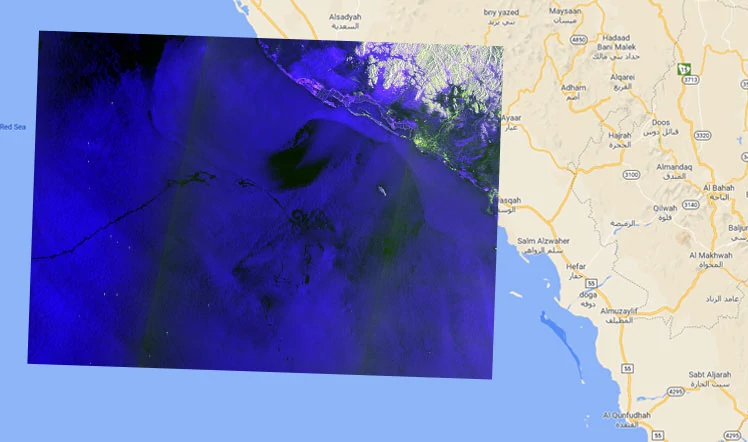
Creating radar mosaics of large areas
Creating mosaics from radar scenes for a given period allows you to show the current status of vast territories.
Can be applied for solving a number of problems - monitoring, classifications, decision making.
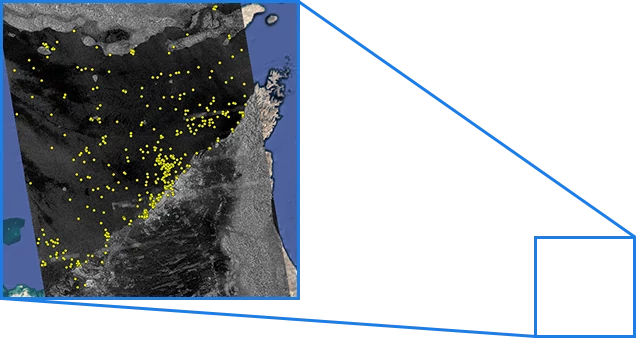
Ships density assessment
Number of ships
- 1
- 25
- 50
- 100
- 200
- 300
- 400
- 500
- 600
- ≥700
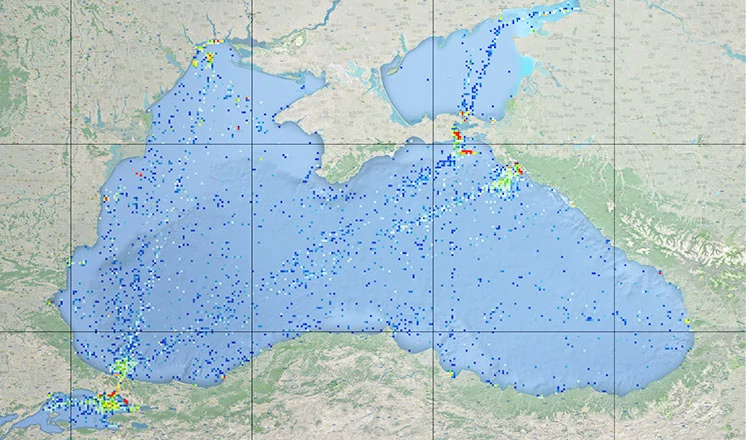
The density of ships in an area of 5 sq. km for the period March-June 2019 according to Sentinel.
The creation of density maps of ships on radar imagery is an effective tool for monitoring water areas and predicting possible changes that might influence the economy.
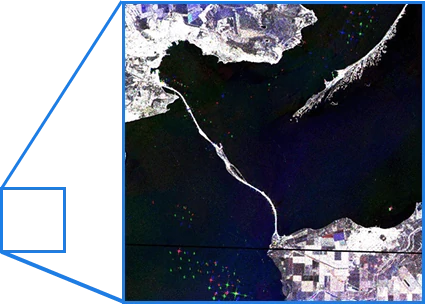
Ship detection monitoring
Ship Monitoring
Ship monitoring from Sentinel-1,
polarization VV,
November - December 2019
Oil spill detection
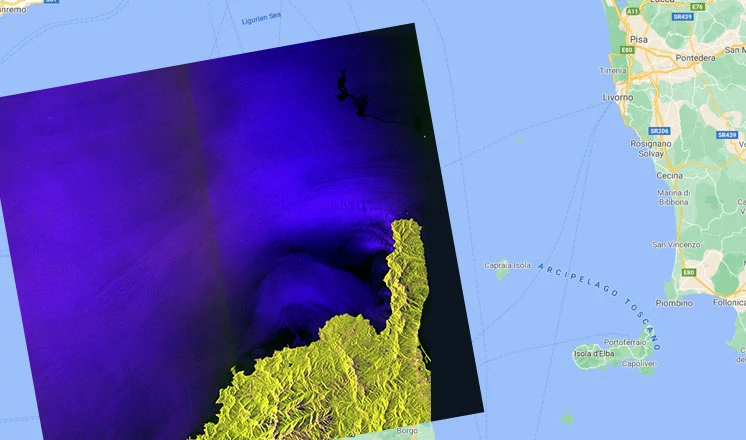
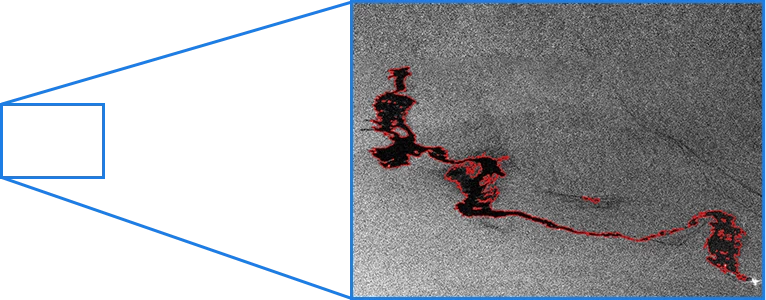
Oil spill in the Mediterranean Sea, October 8, 2018
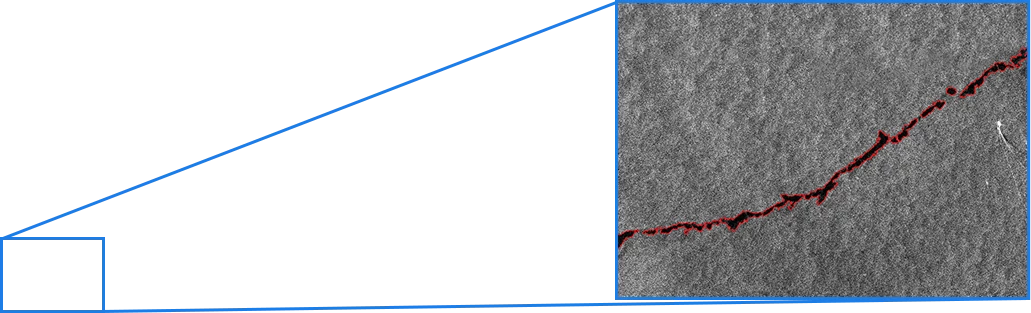
Intensive oil and gas development results in extensive air, water and land pollution, wildlife and plant degradation, exhaustion of natural resources, ecosystem disturbance, desertification and considerable losses in biological and landscape diversity. There are also natural pollution sources in the sea like mud volcanoes or griffins. High resolution SAR data can be used to detect and identify man-made oil spills.