Infrastructure
Construction of precision interferogram map
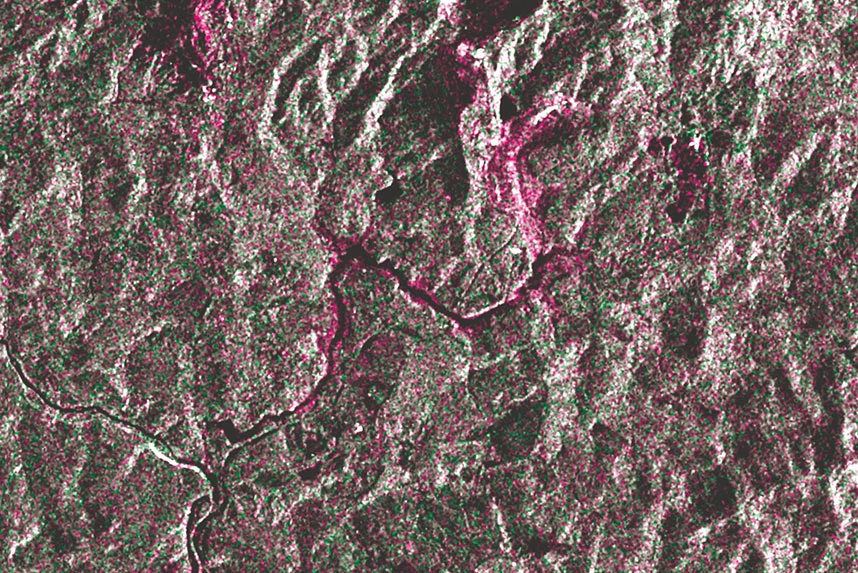
An Interferogram allows to see the differences of land subsidence in an area after comparing satellite SAR data from different time periods. It is important that both radar images are made from the same orbit and position in low earth orbit. An interferogram is useful for monitoring and preventing disasters from occurring. It is possible to see changes as critical as a couple of millimeters, and is used in various cases - dam, quarry, bridge, building, airport and hundreds of other objects and places for subsidence monitoring (changes in elevation).
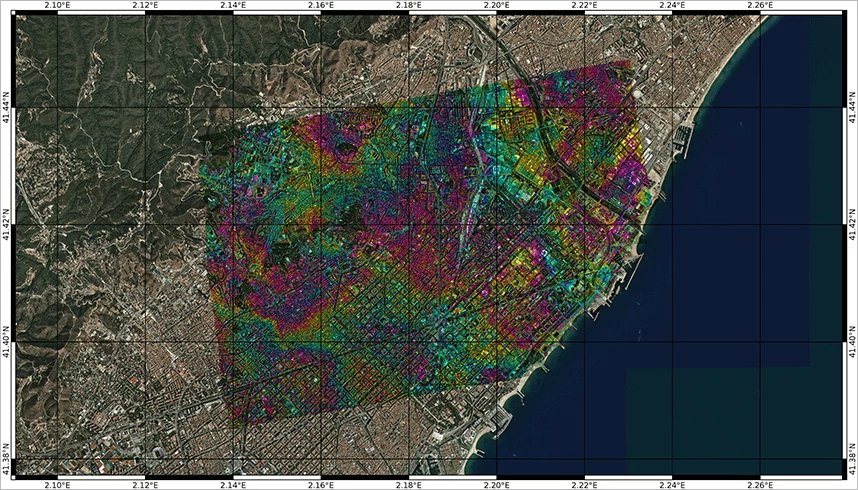
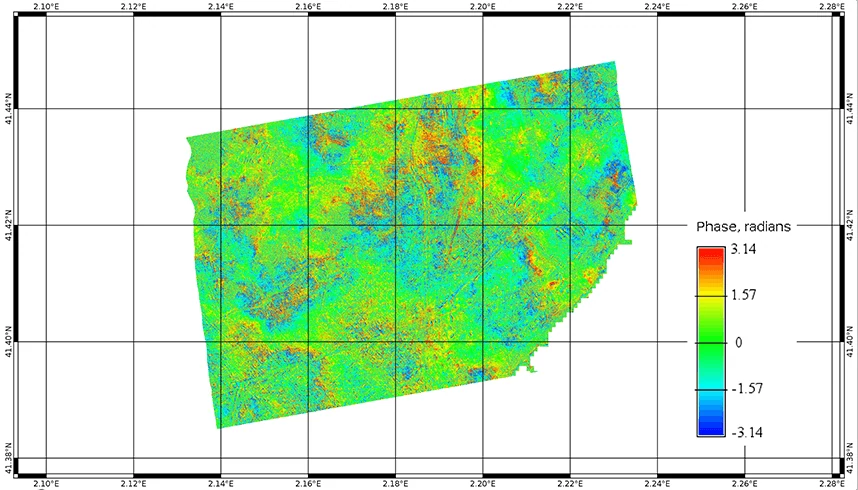
July 4, 2008 and August 17, 2008
Construction displacement map
-
Medium subsidence (4.5 mm/year).
Area near shopping boutiques.
-
High subsidence (6 mm/year).
Сentral bridge area.
-
Medium subsidence (3.7 mm/year).
Lake area in the park.
-
Medium subsidence (3.5 mm/year).
Area of the central green recreation area.
-
Small subsidence (2.5 mm/year).
-
High uplift (1 mm/year).
Central plaza.
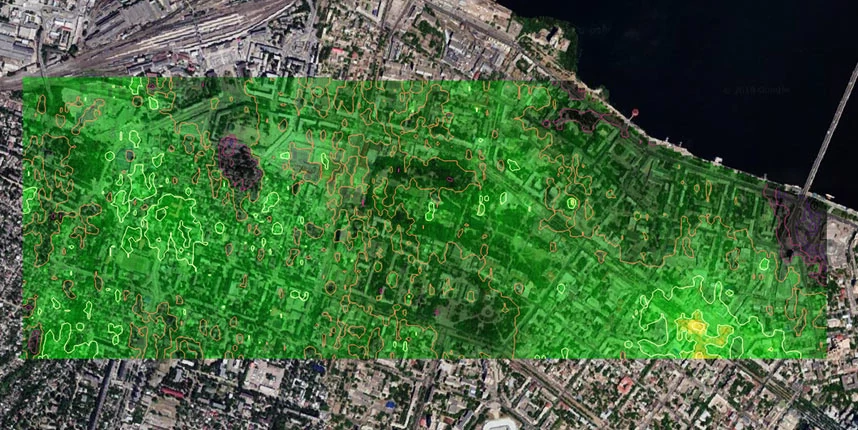
Average velocity vertical displacement map (January - November 2019) center of Dnipro city (Ukraine)
Dam collapse monitoring
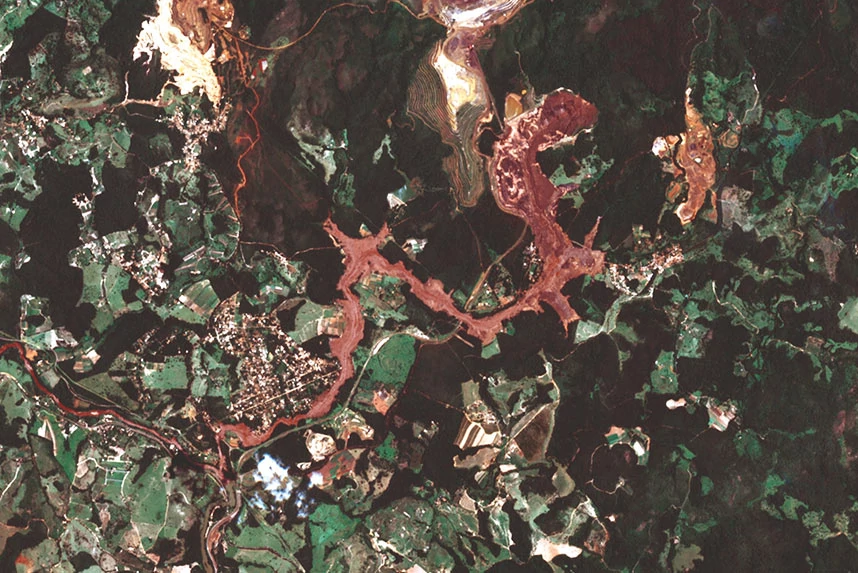
The Brumadinho dam collapse occurred on January 25, 2019 due to integrity violation of a tailings dam at the Córrego do Feijão iron ore mine near the Brumadinho city (Minas Gerais, Brazil). As a result the mudflow covered the mine administrative territory and spread to adjacent settlements, causing numerous casualties. About 12 million cubic meters of tailings polluted over 300 kilometers of Paraopeba River.
EOS SAR provides:
- Continuous monitoring of infrastructure with increased man-made danger;
- Timely detection of emergency situations;
- Monitoring of emergency distribution in space and time;
- Polluted areas mapping.