Agriculture
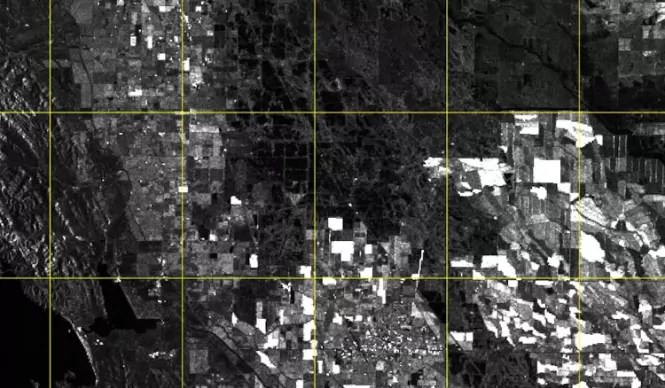
Harvesting monitoring
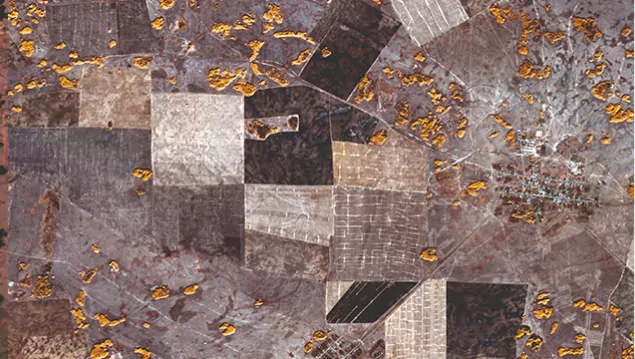
In the northern regions of Kazakhstan, the main crops are harvested from August to October. SAR harvesting monitoring is a means to control the effectiveness of state programs implementation providing support to farmers.
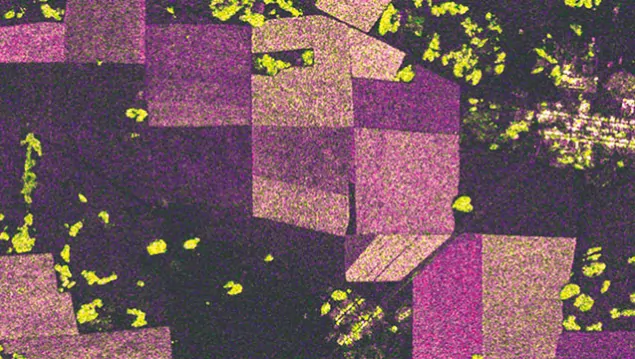
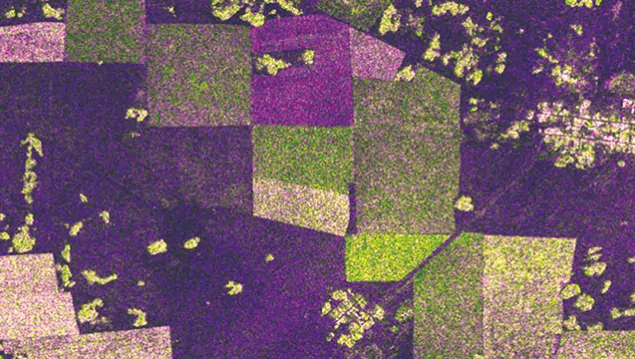
Different-time SAR images allows to track changes on field surface resulting from phenophase changes and agricultural works such as sowing, plowing, harvesting, etc.
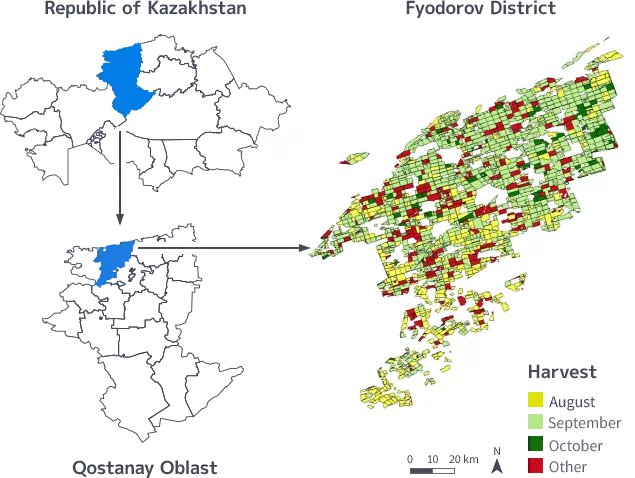
North Kazakhstan
SAR data
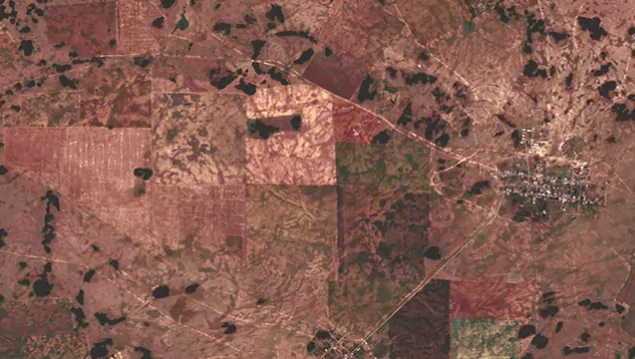
Optical data
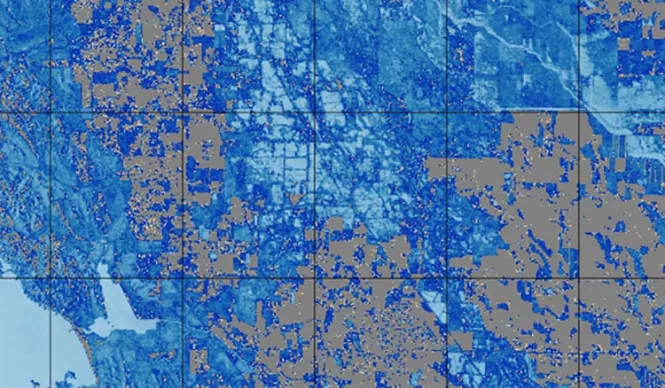
Damaged crop mapping
The Effect Flooding had on Agriculture in Nebraska, USA. Rising water levels in Nebraska, that had damaged hundreds of homes and caused three deaths have also taken a heavy toll on agriculture. The flood had inundated thousands of acres, threatening stockpiled grain and killing multiple livestock.
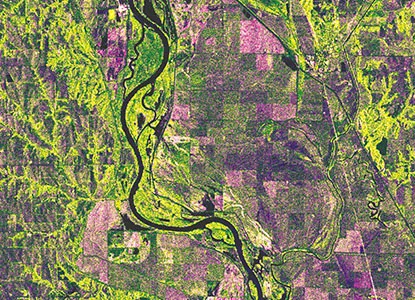
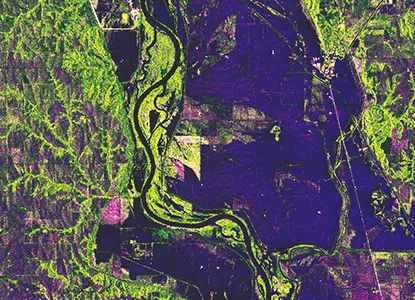
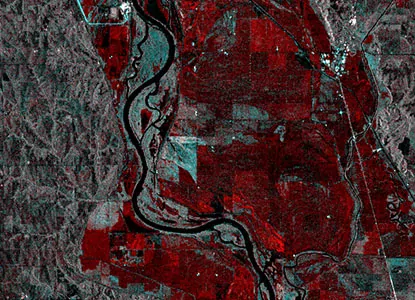
The effect flooding had on agriculture in Nebraska, USA
A prolonged excess of moisture in plants root zone is one of the main causes of crop death. Water prevents the oxygen flow, which leads to plant root damage and death.
Spaceborne SAR time series imaging can be used to detect the flooding events, monitor and estimate area of overwatered farm lands.
Soil moisture assessment
Soil moisture assessment plays a key role in agriculture and directly affects plant health and productivity. A prolonged lack of moisture may cause agricultural drought and crop damage.
Use soil moisture maps to control crop watering regime, and to identify waterlogged and arid fields.
θm, m-3/m-3
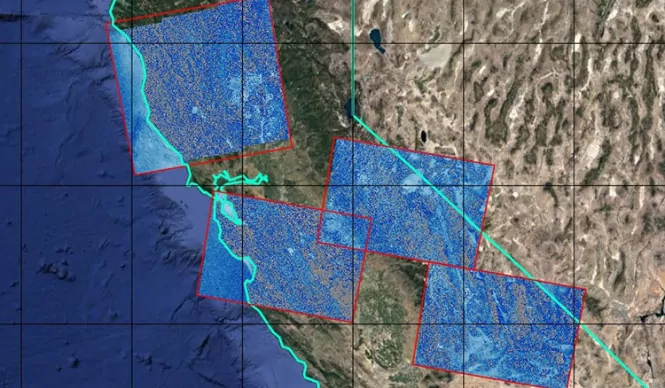
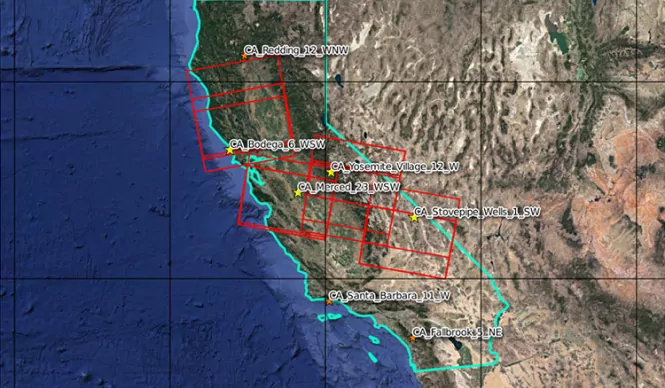
California, US: volumetric water content modeled maps