Geohazards
Volcanic eruptions monitoring
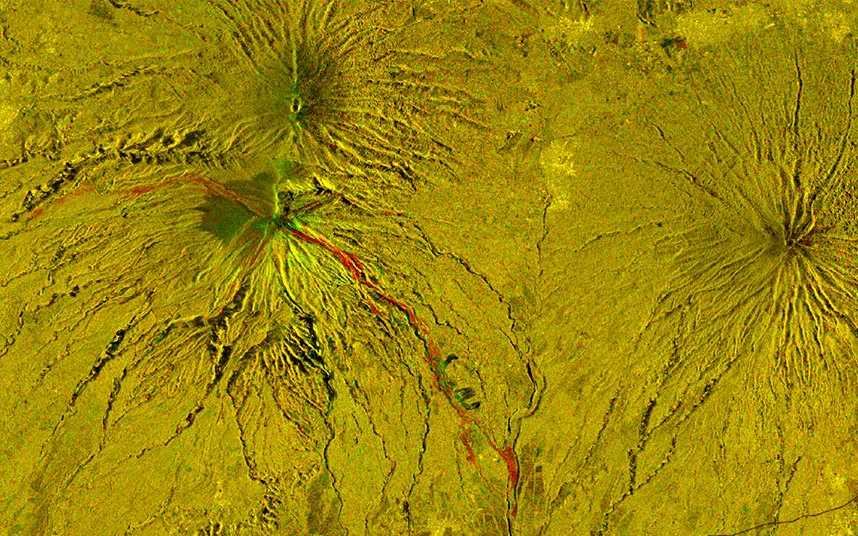
Multitemporal composite June 2-8, 2019
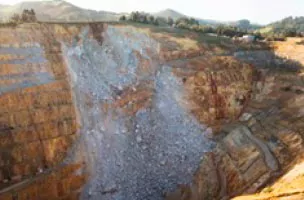
Volcán de Fuego eruption (Guatemala)
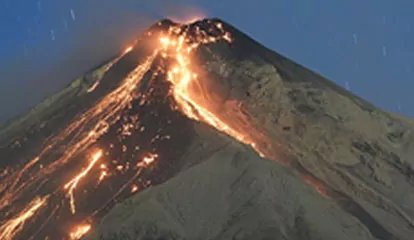
On June 3, 2018, Volcán de Fuego erupted in Guatemala, becoming the largest eruption in Guatemala since 1929, including powerful lava flows and causing about 200 human fatalities.
With the help of a time radar survey, you will be able to quickly identify places and areas that have been destroyed by lava.
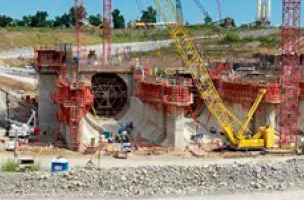
Flood zones detection and monitoring
Grand Bahama. Freeport. Consequences of hurricane Dorian (5 category).
According to radar data, it is quite easy to construct vector maps of flood zones and estimate their area and consequences.
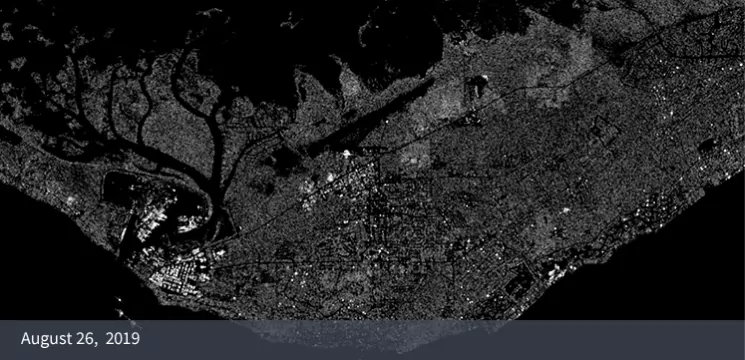
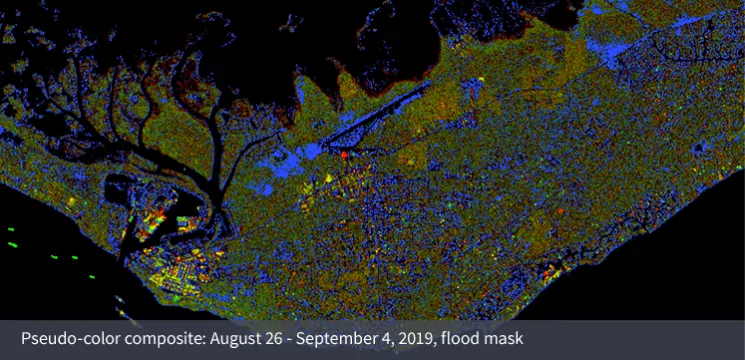
Flood zones are highlighted in blue.
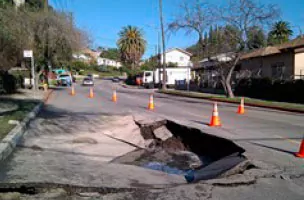
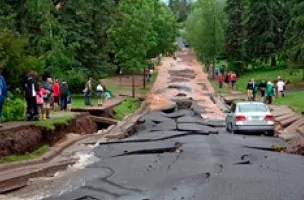
Ground and infrastructure subsidence detection
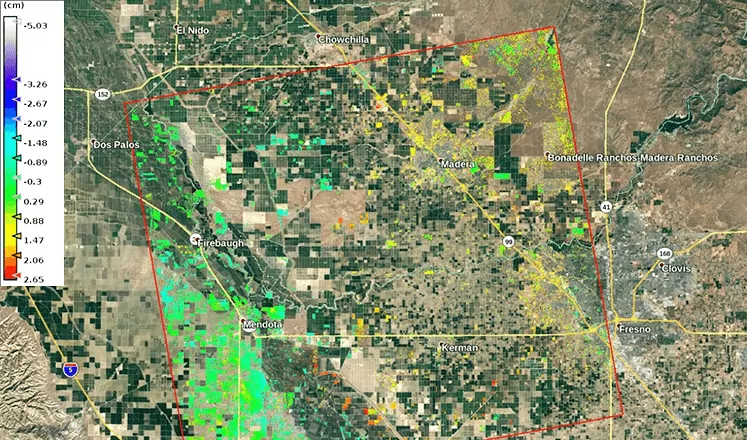
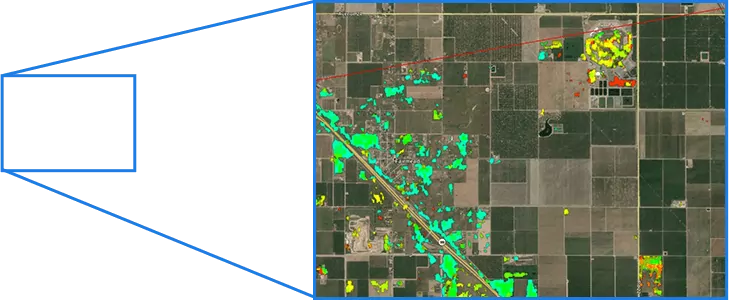
Central California.
Madera and Fresno counties
Surface displacement maps are constructed based on differential radar interferometry
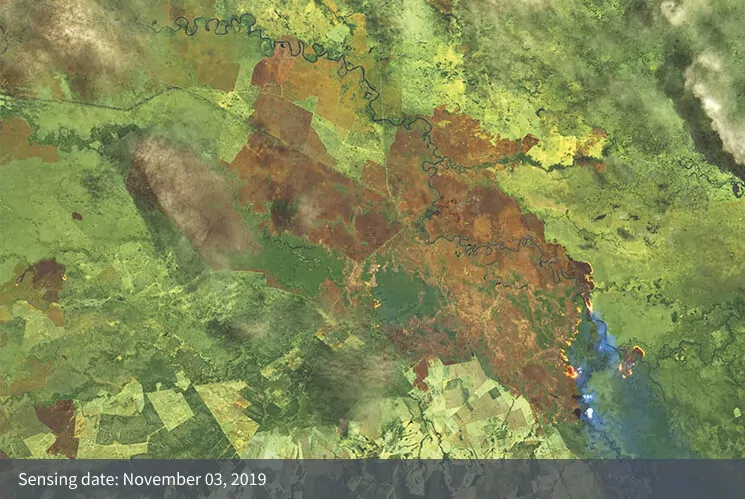
Wetland fire mapping
From October 25th, large-scale fires have raged on the wetlands of Brazil on the outskirts of the Brazilian city of Corumba in Mato Grosso do Sul. The fire raged in one of the most bio-diverse areas in the world. Media reports, more than 50,000 hectares have been affected since the fires have begun in this area.
SAR images are used for monitoring fires in most types of areas. It is possible to calculate and assess the zone of damage caused by fire.
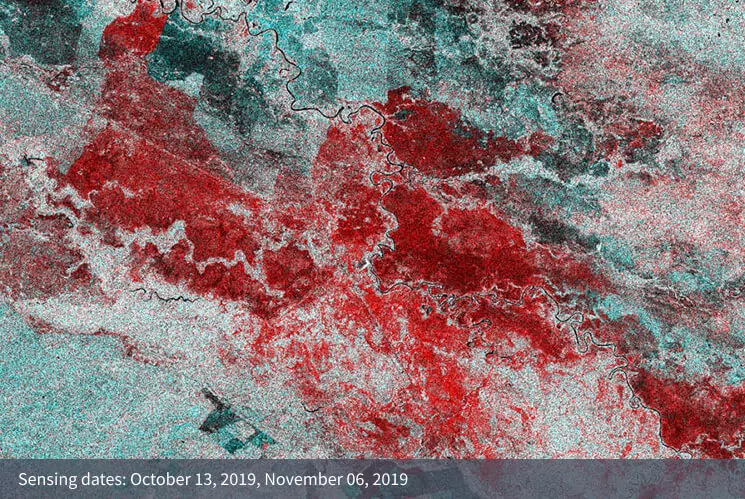
Damaged areas are in red